2D Transformations

Working as an online tutor for the Bachelor of Computer Science Degree from Goldsmiths, University of London on the Coursera platform. This is the first undergraduate degree programme available on Coursera, one of the world’s leading online education providers.
The programme has been designed to equip students to access careers in emerging technologies, providing opportunities for students to study machine learning, data science, virtual reality, game development and web programming to meet the needs of career changers in industry as well as those taking their first steps into the innovative computer science field.
The P5.js library has built-in Transform functions that make it easy to manipulate objects in a sketch, making them translate , rotate, and scale. This tutorial will introduce you to these functions so that you can use them in your sketches.
Before we begin, think back to your school days when you played with graph paper, and were learning the Cartesian coordinate system, back at school you were taught to place the origin (0,0) in the centre, with the y-axis pointing up and the x-axis pointing right
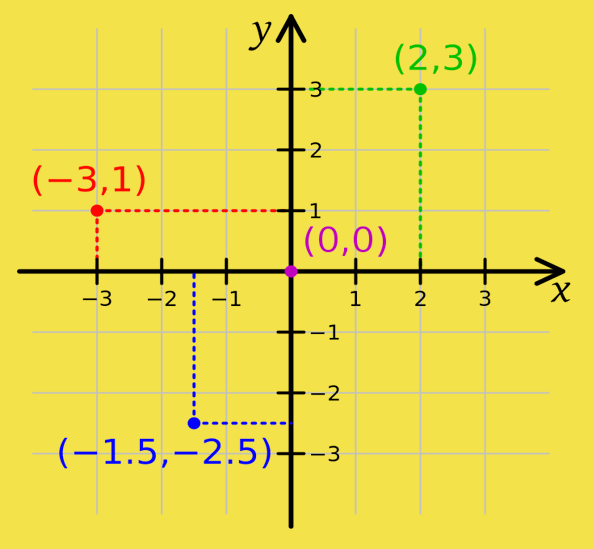
In computing however, this is rarely the case. Most programming languages place the origin (0,0) at the top left, and the y-axis is reversed, this is also true for the Coordinate System and Shapes in p5.js .
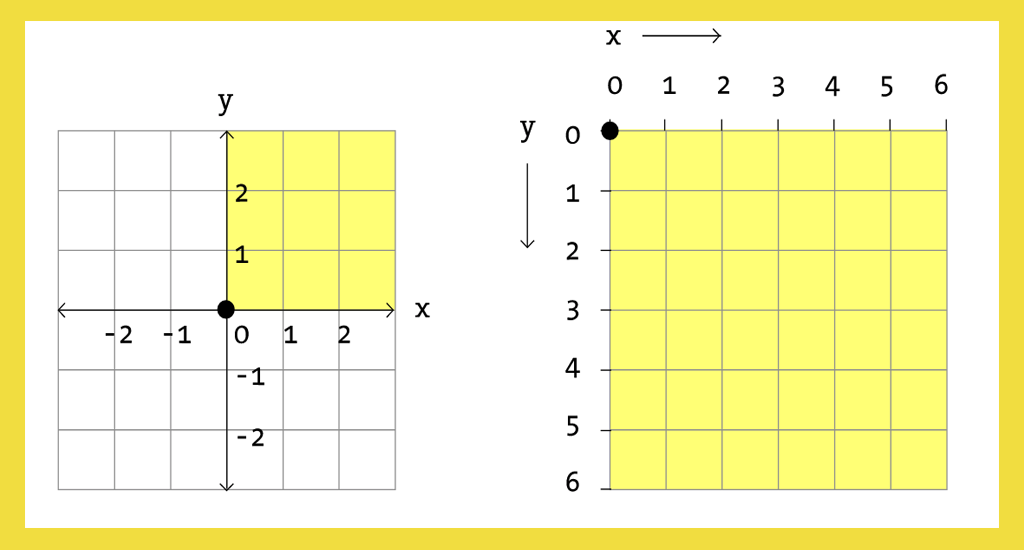
So now you know this, lets write a simple function to actually draw this grid in a p5 sketch:
const grid = { size: 50, stroke: '#dff', colour:'teal'};

function setup() {
  createCanvas(400, 400);
}

function draw() {
  background(220);
  drawGrid(grid);
}

const drawGrid = g => {
  push();
    stroke(g.stroke);
    fill(g.colour);

    for (let lineX = -width; lineX < width; lineX += grid.size) {
      line(lineX, -height, lineX, height);
      text(lineX, lineX+1, 10);
    }

    for (let lineY = -height; lineY < height; lineY += grid.size) {
      line(-width, lineY, width, lineY);
      text(lineY, 1, lineY+10);
    }
  pop();
}