Debugging Django Applications

Working as an online tutor for the Bachelor of Computer Science Degree from Goldsmiths, University of London on the Coursera platform. This is the first undergraduate degree programme available on Coursera, one of the world’s leading online education providers.
The programme has been designed to equip students to access careers in emerging technologies, providing opportunities for students to study machine learning, data science, virtual reality, game development and web programming to meet the needs of career changers in industry as well as those taking their first steps into the innovative computer science field.
Debugging Django Applications in VSCode
All new programmers typically start with using console.log() statements in JavaScript or print and pprint statements in python to see what is going on in their code.
In python, If you are using print to log out dictionaries, you might consider using pprint instead, as it will nicely format your code with indentation.
Although this is very useful, as applications get larger, it gets increasingly painful inserting a print statement after every couple of code lines!
Luckily, the popularity of python and Django means that there are a lot of tools available to help you debug your application more efficiently.
VSCode, like all good IDE's, as well as providing support for syntax highlighting, and code refactoring provides more advanced debugging tools.
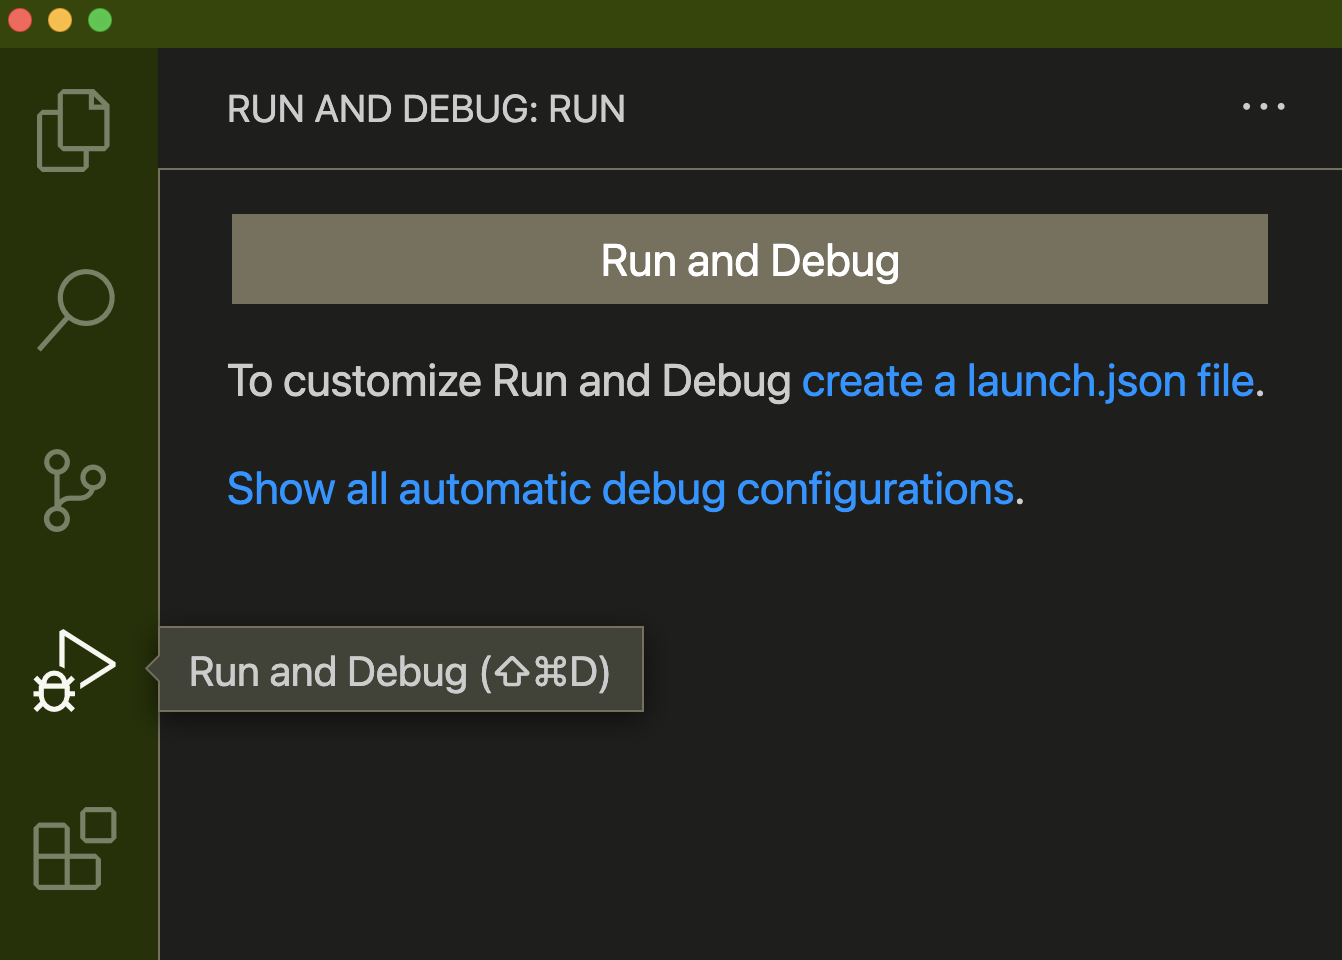
The first time select the run and debug in VScode, you will see a message that prompts you to create a launch.json file:
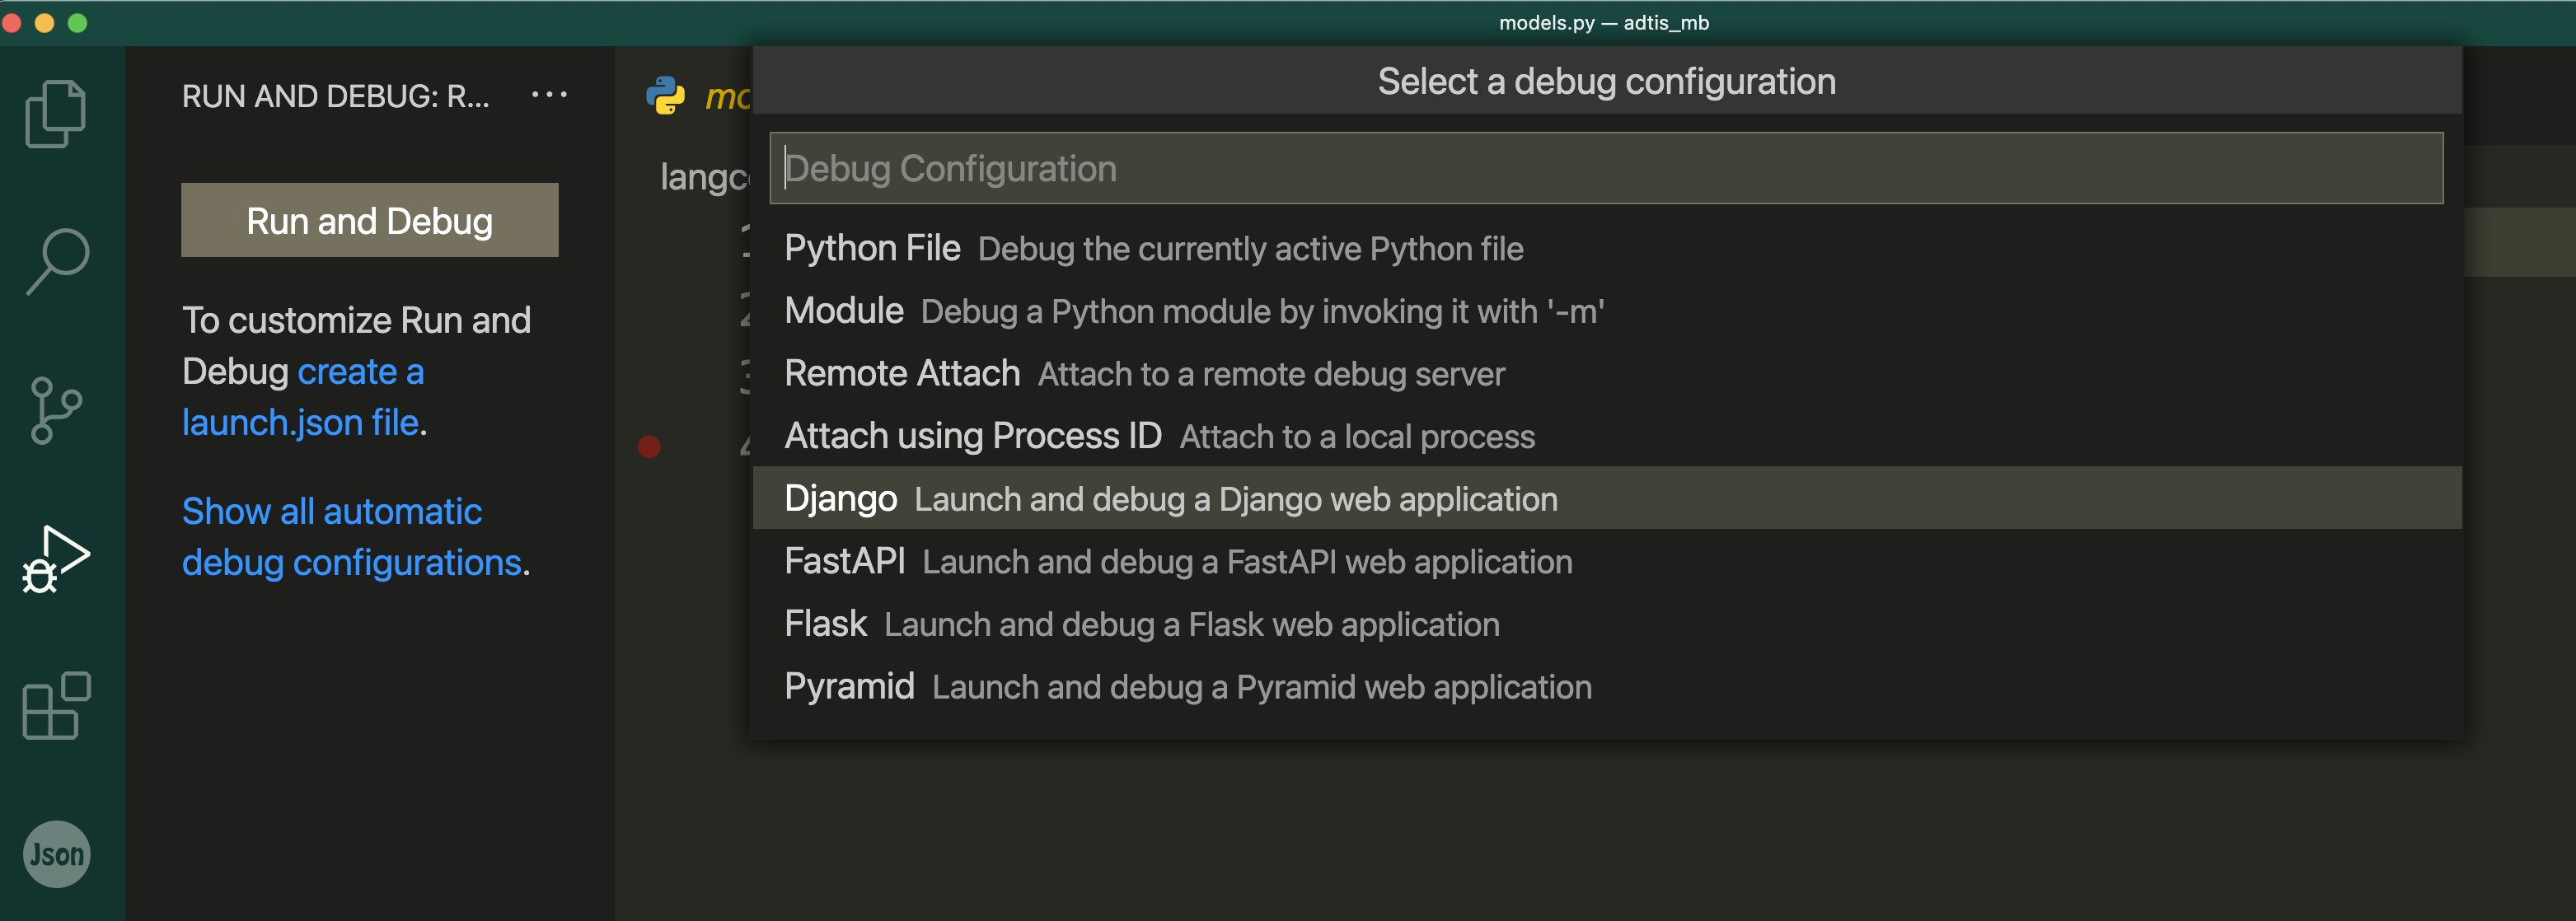
Essentially you need to create a launch profile so VScode knows how to run and debug your application. So select the create a launch.json file link, this opens a prompt, and from the prompt select Django Launch and debug a Django web application:
When you do this, VSCode creates your launch.json file and stores it in a .vscode folder inside your project. Lets take a look at the file:
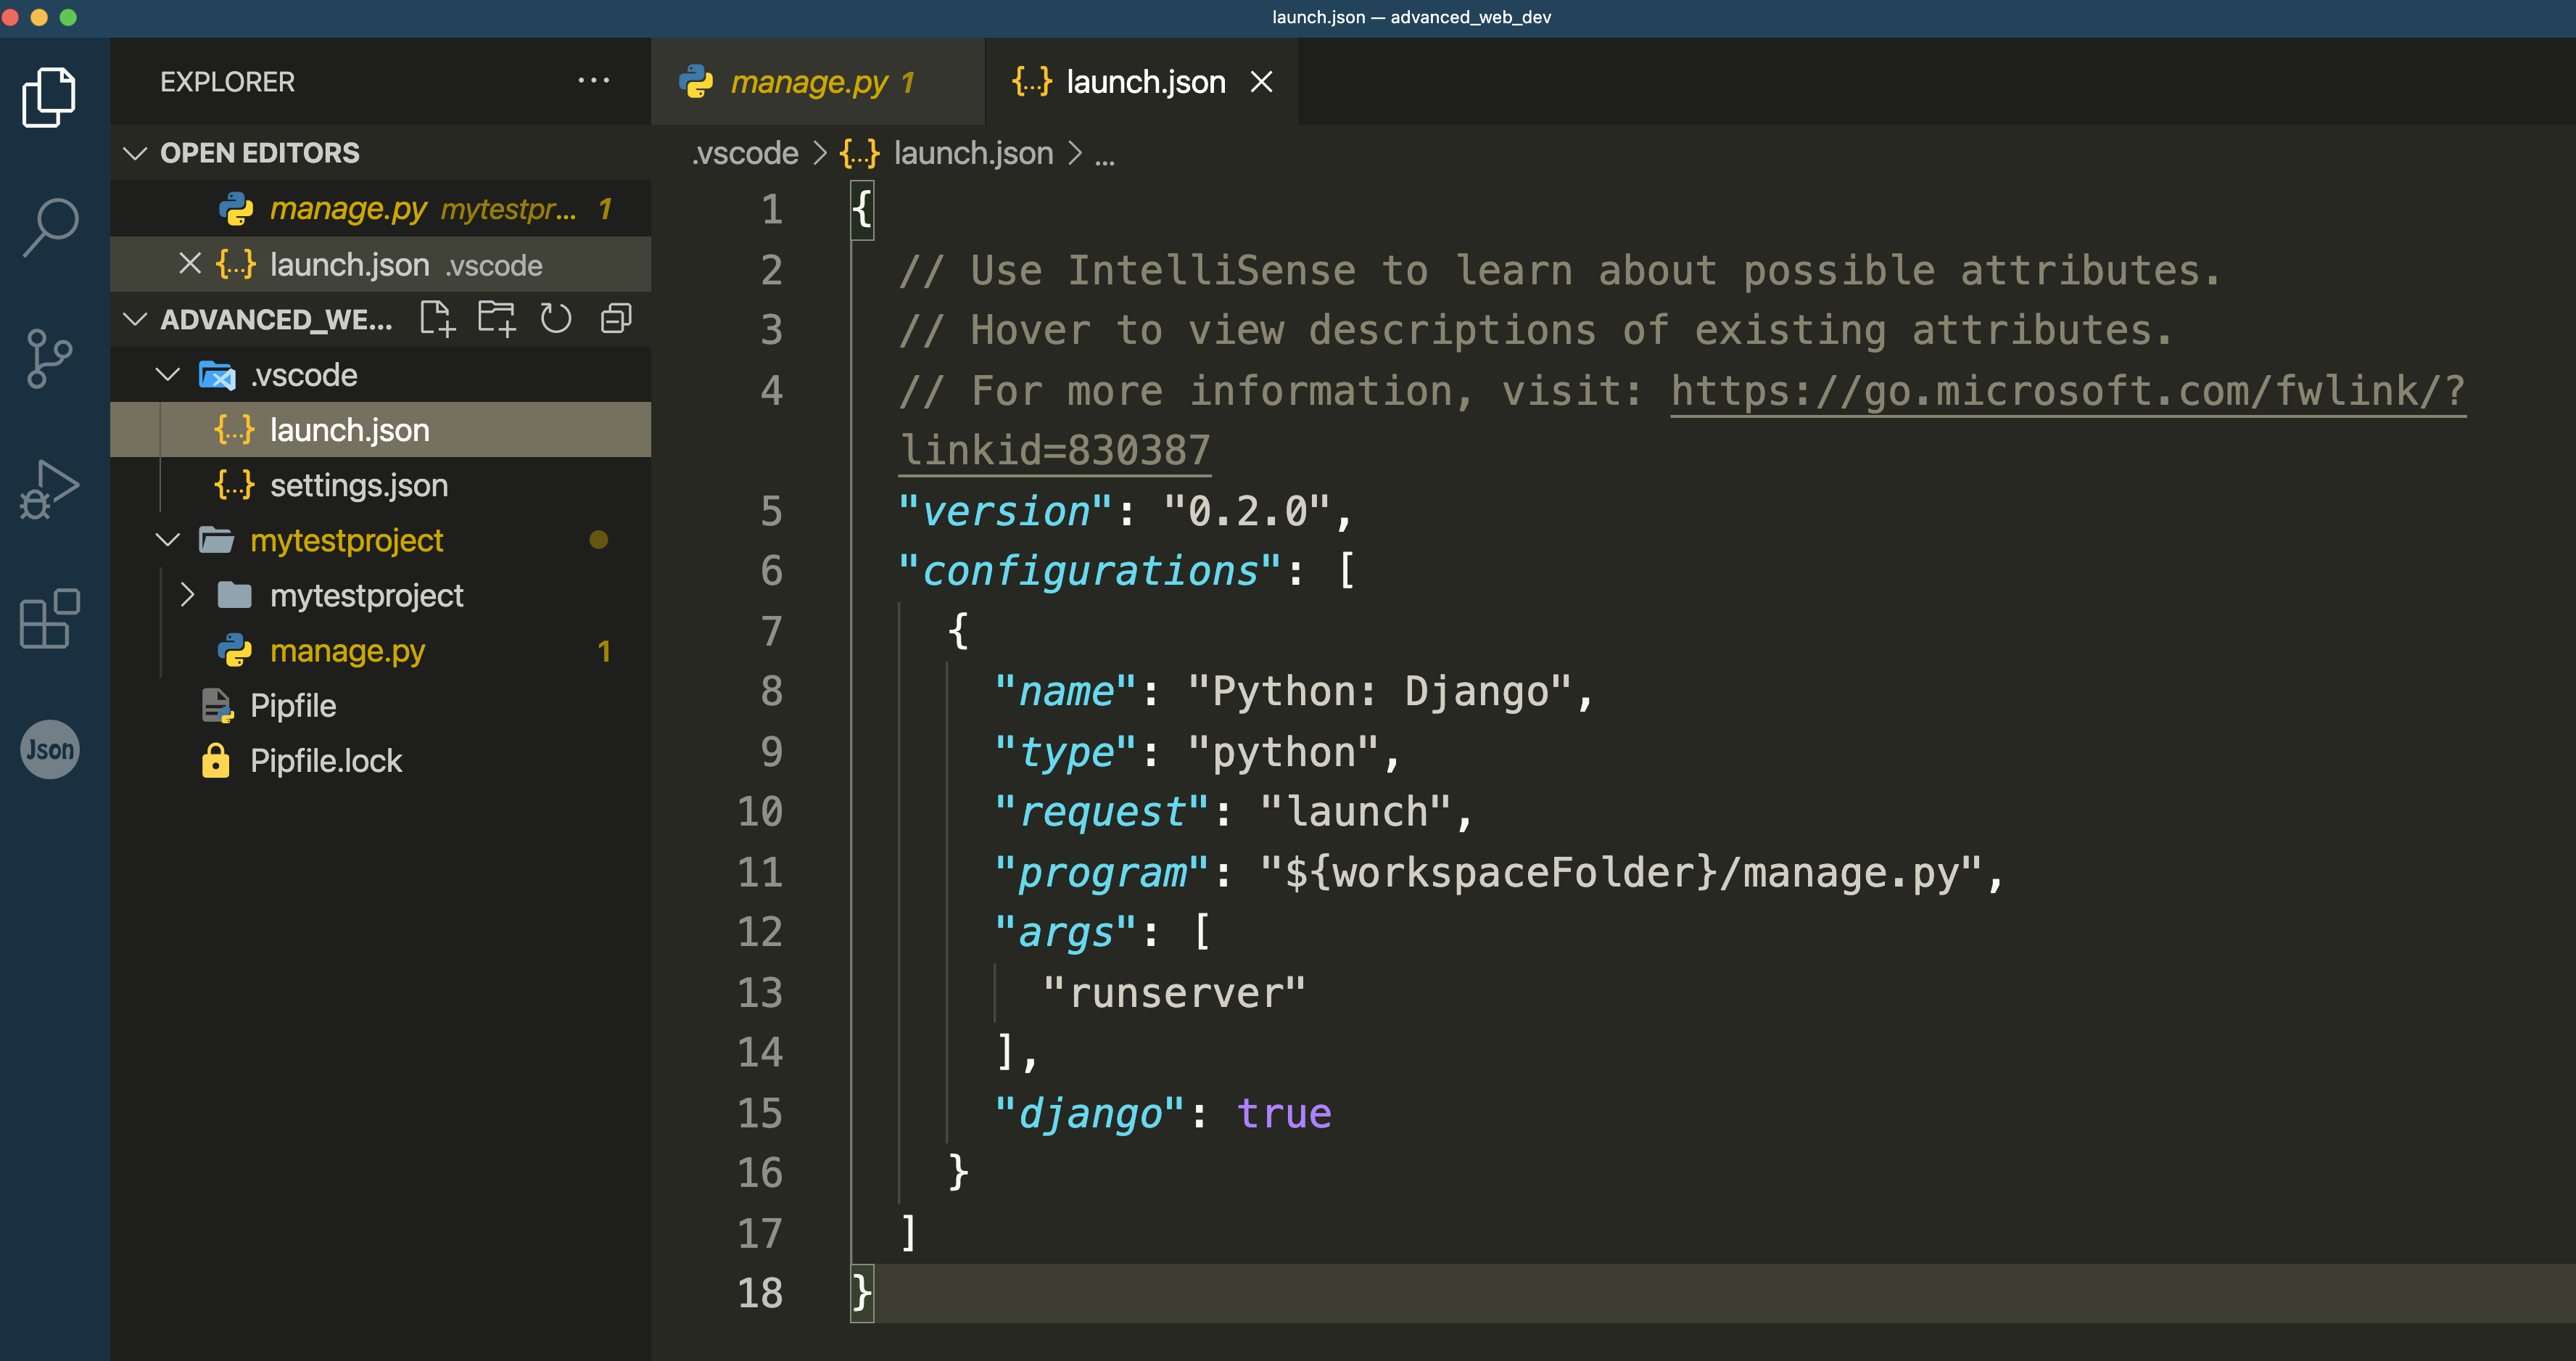
The Key:Value pairs in your launch profile let VSCode know to use the current python interpreter to run the manage.py file which exists in our workspace folder. One of the arguments by default that is passed to manage.py is the runserver command.
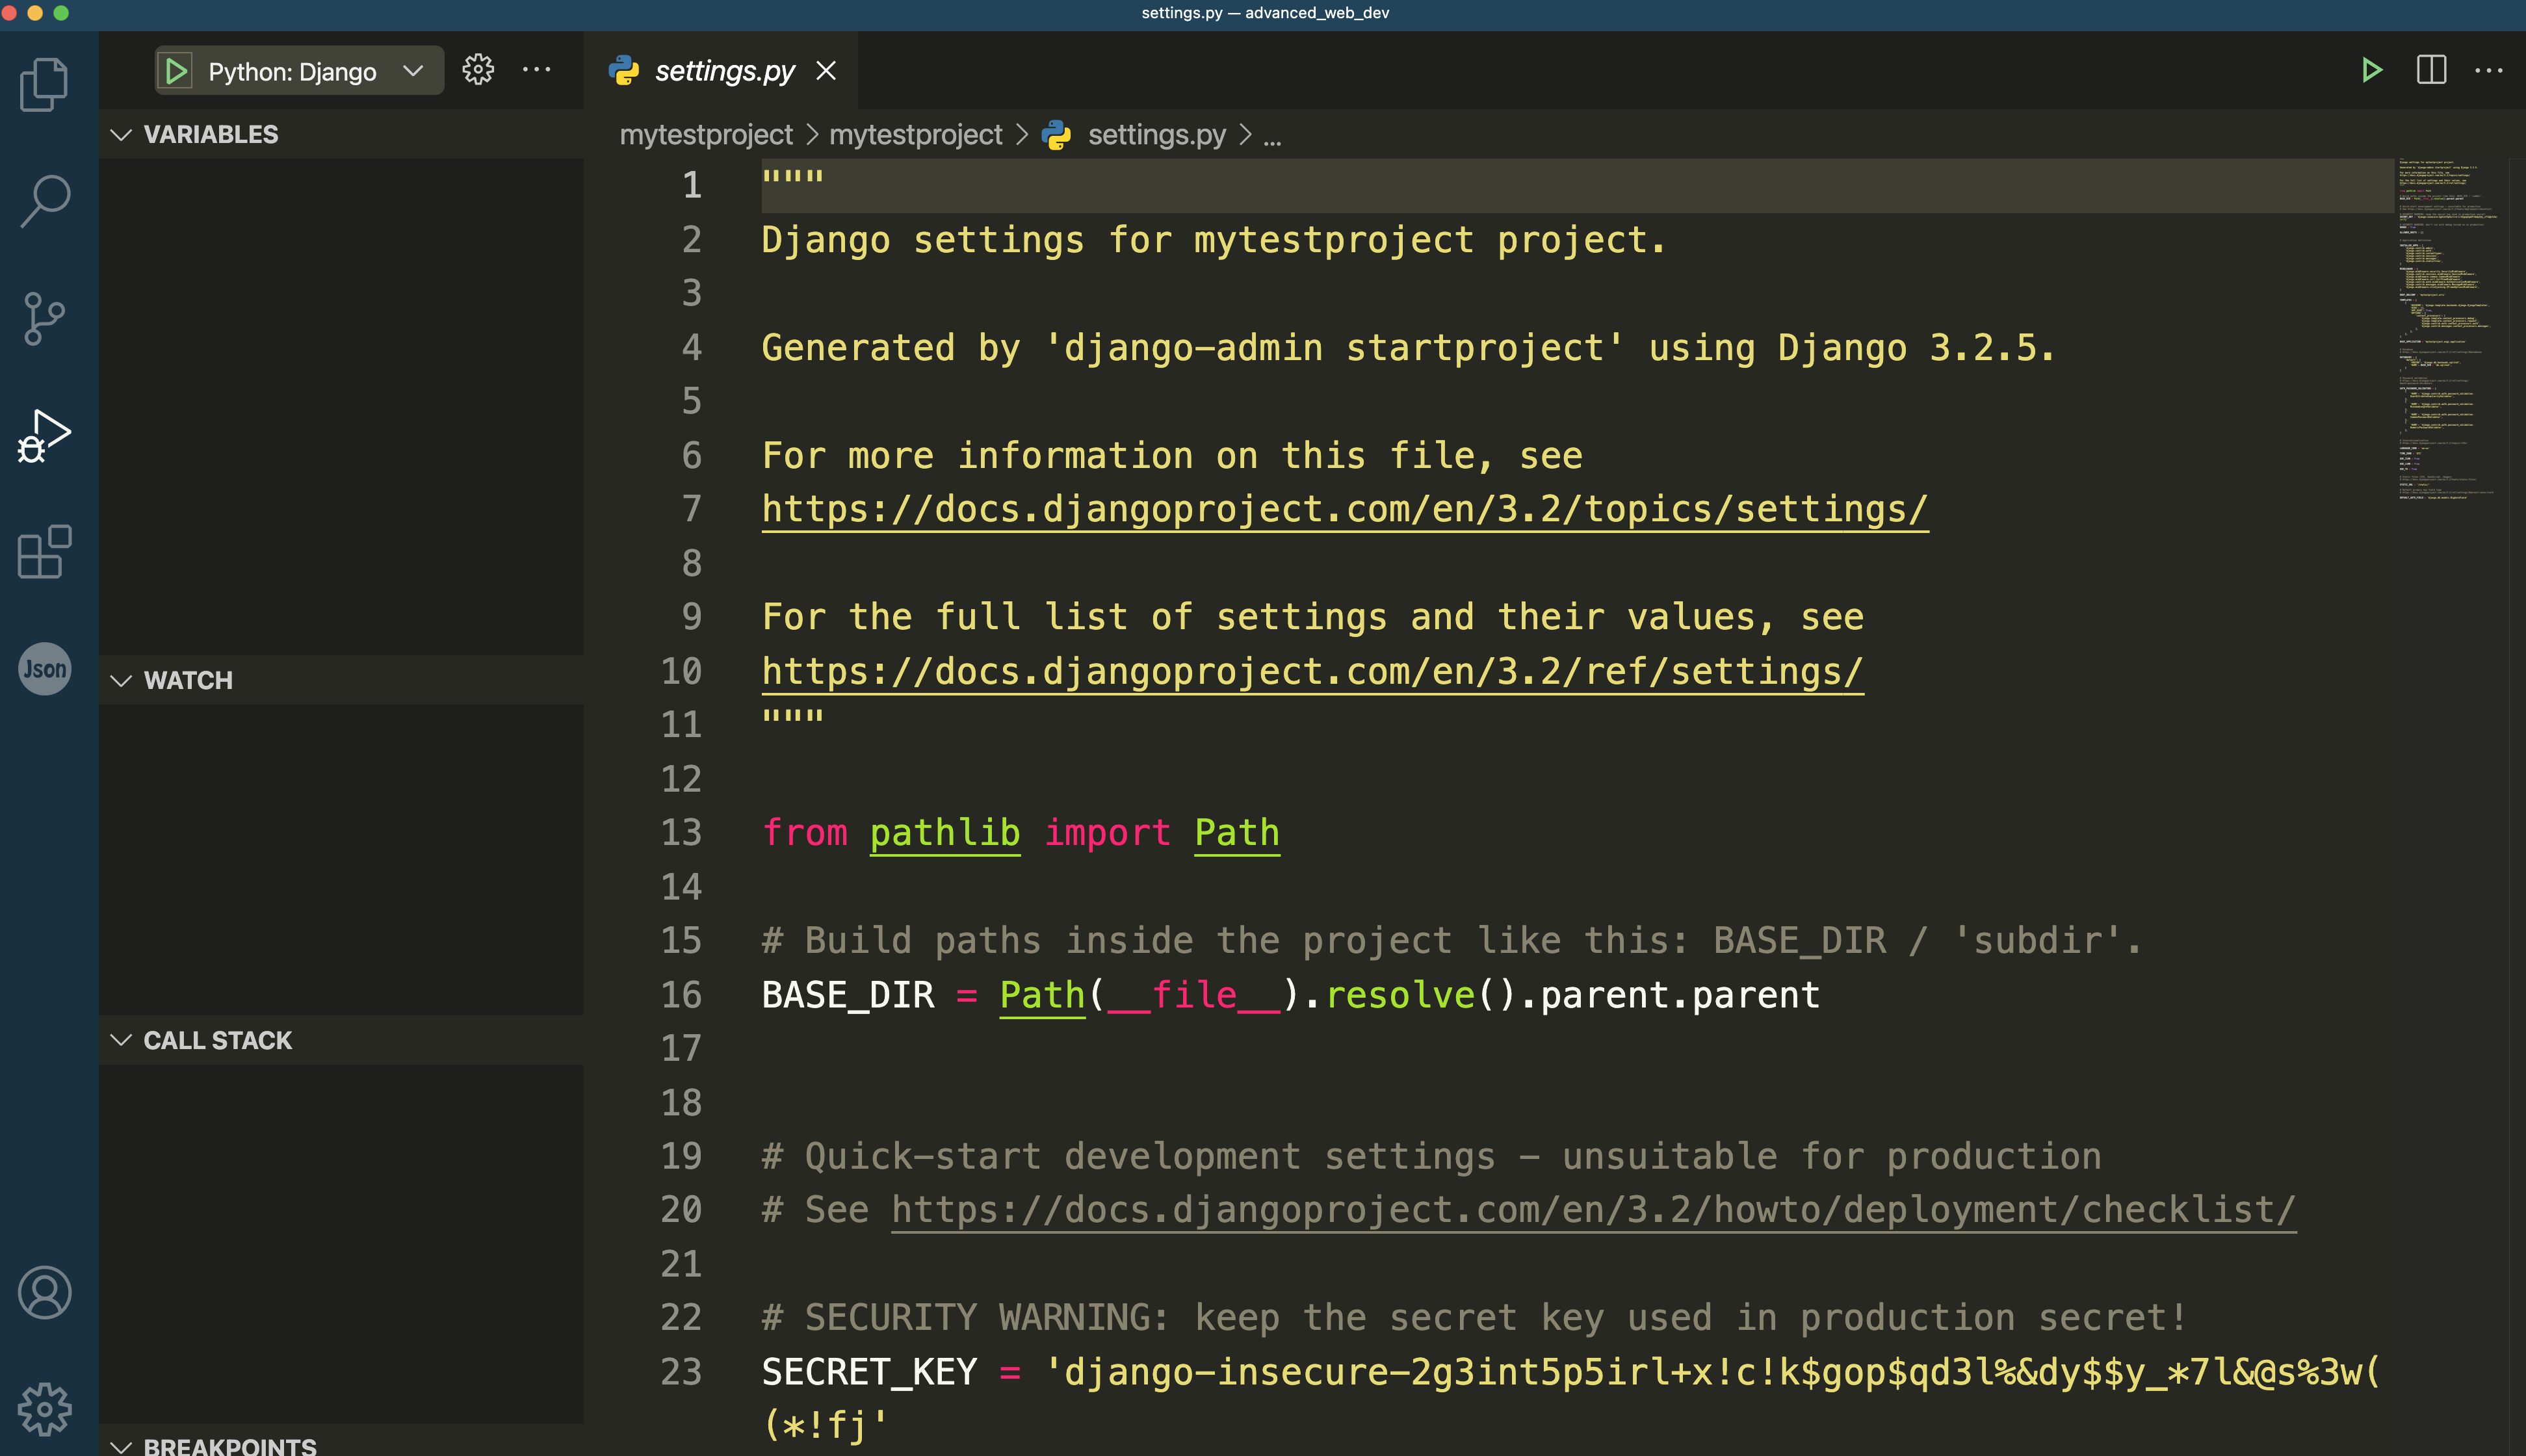
Here we need to provide an additional argument to specify a port so that we do not clash with port 8000 which is used by the default django app when we runserver.
{
  // Use IntelliSense to learn about possible attributes.
  // Hover to view descriptions of existing attributes.
  // For more information, visit: https://go.microsoft.com/fwlink/?linkid=830387
  "version": "0.2.0",
  "configurations": [
    {
      "name": "Python: Django",
      "type": "python",
      "request": "launch",
      "program": "${workspaceFolder}/manage.py",
      "args": [
        "runserver",
        "9000"
      ],
      "django": true
    }
  ]
}
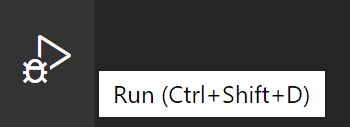
Now you have the launch profile configured, if you select the Run and Debug icon and open your run and debug panel, you can see that VSCode is now set to start debugging your application:
You can now start inserting breakpoints into your code to start debugging it:
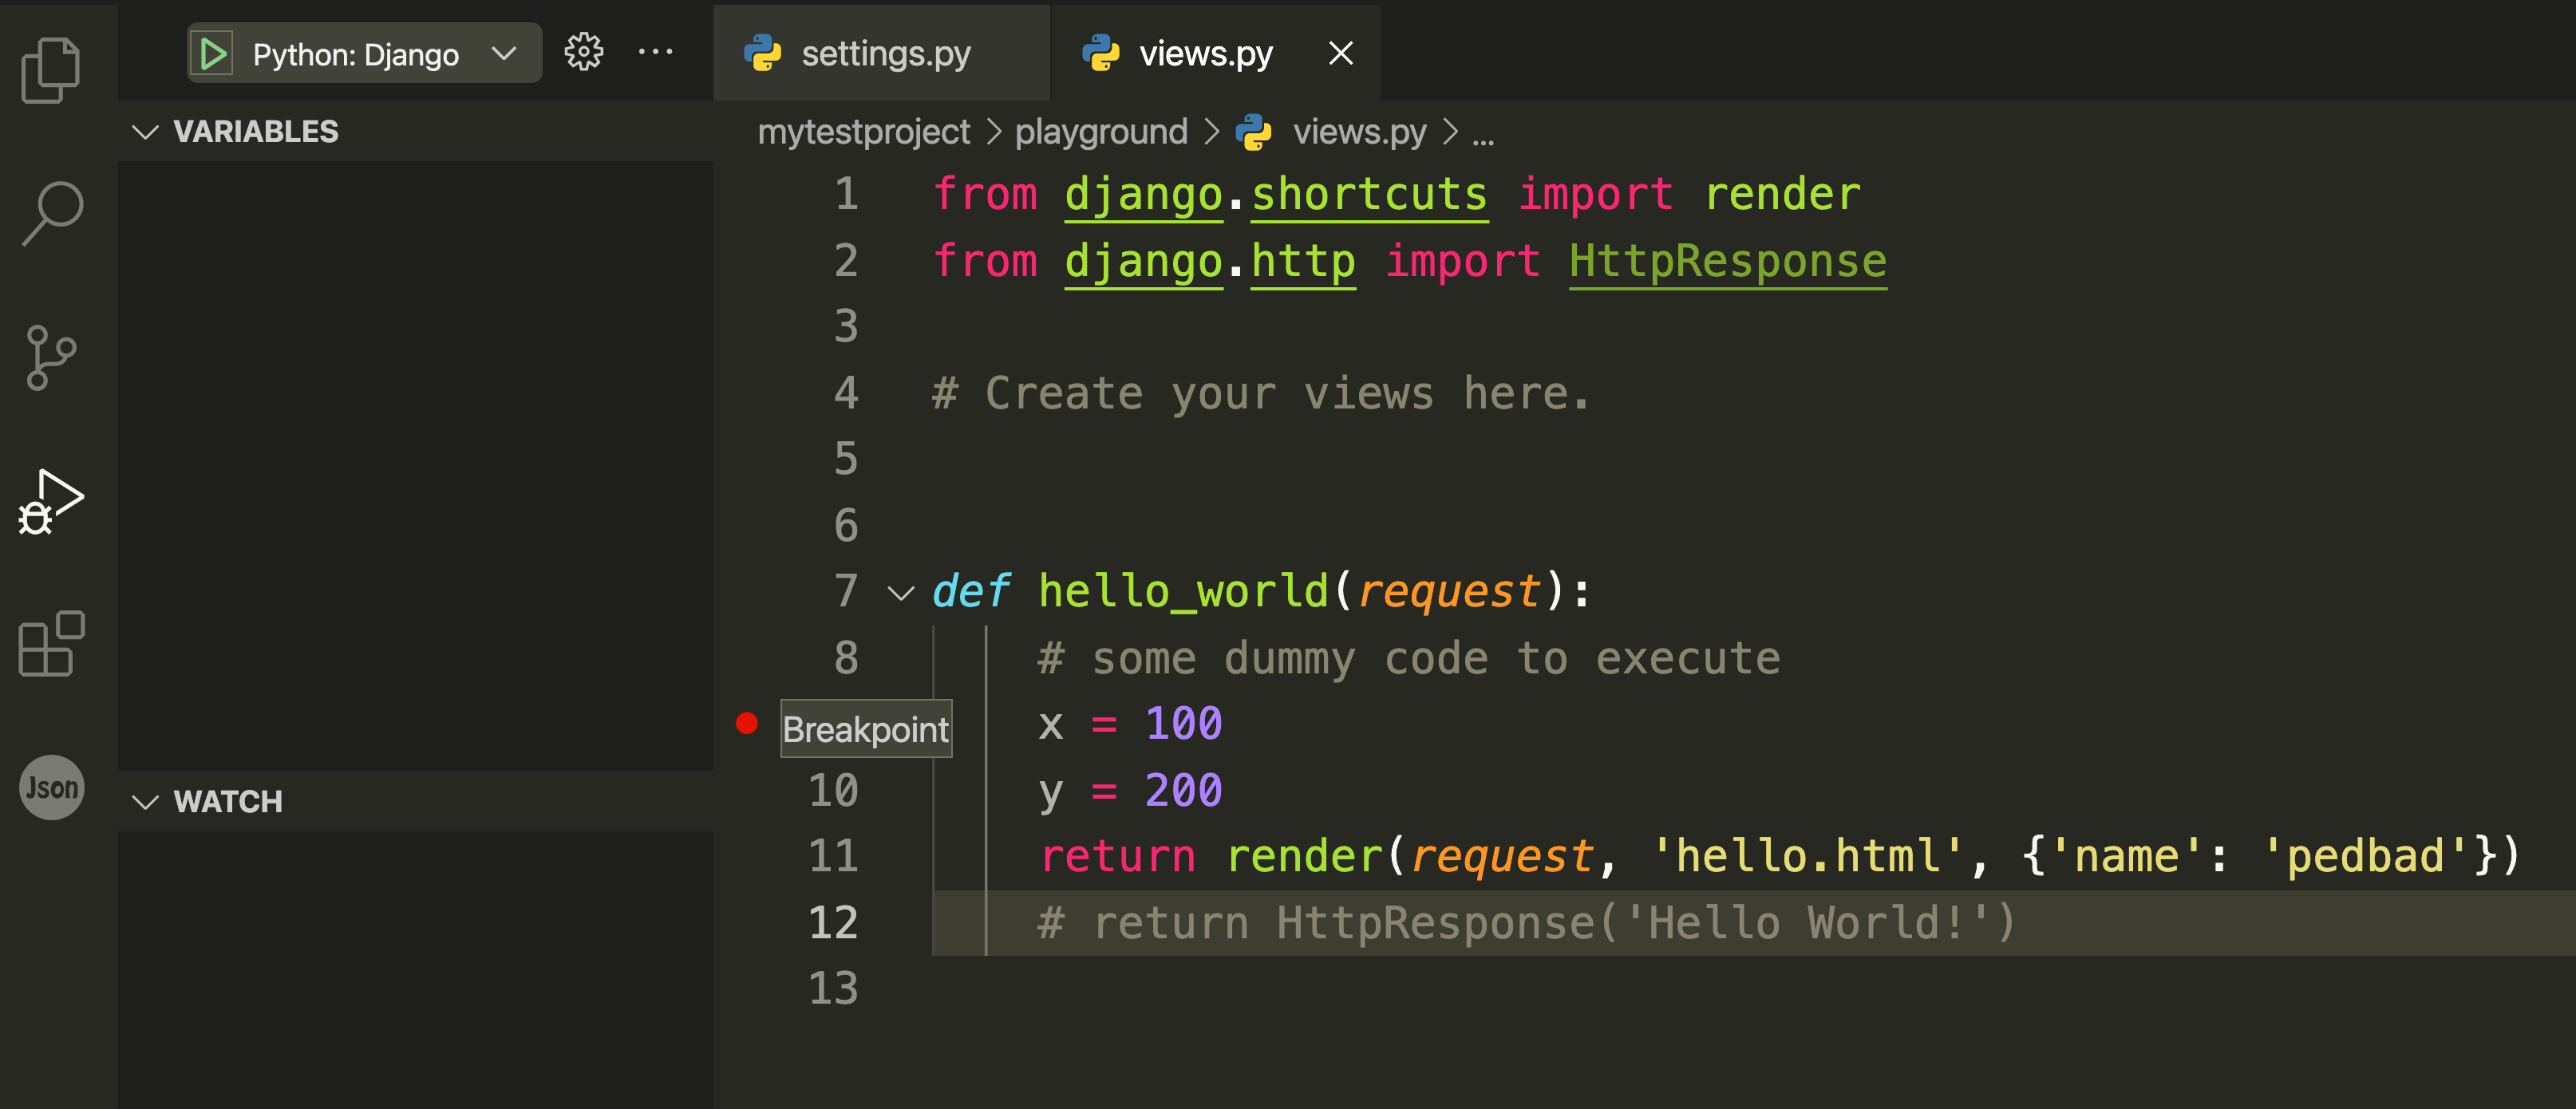
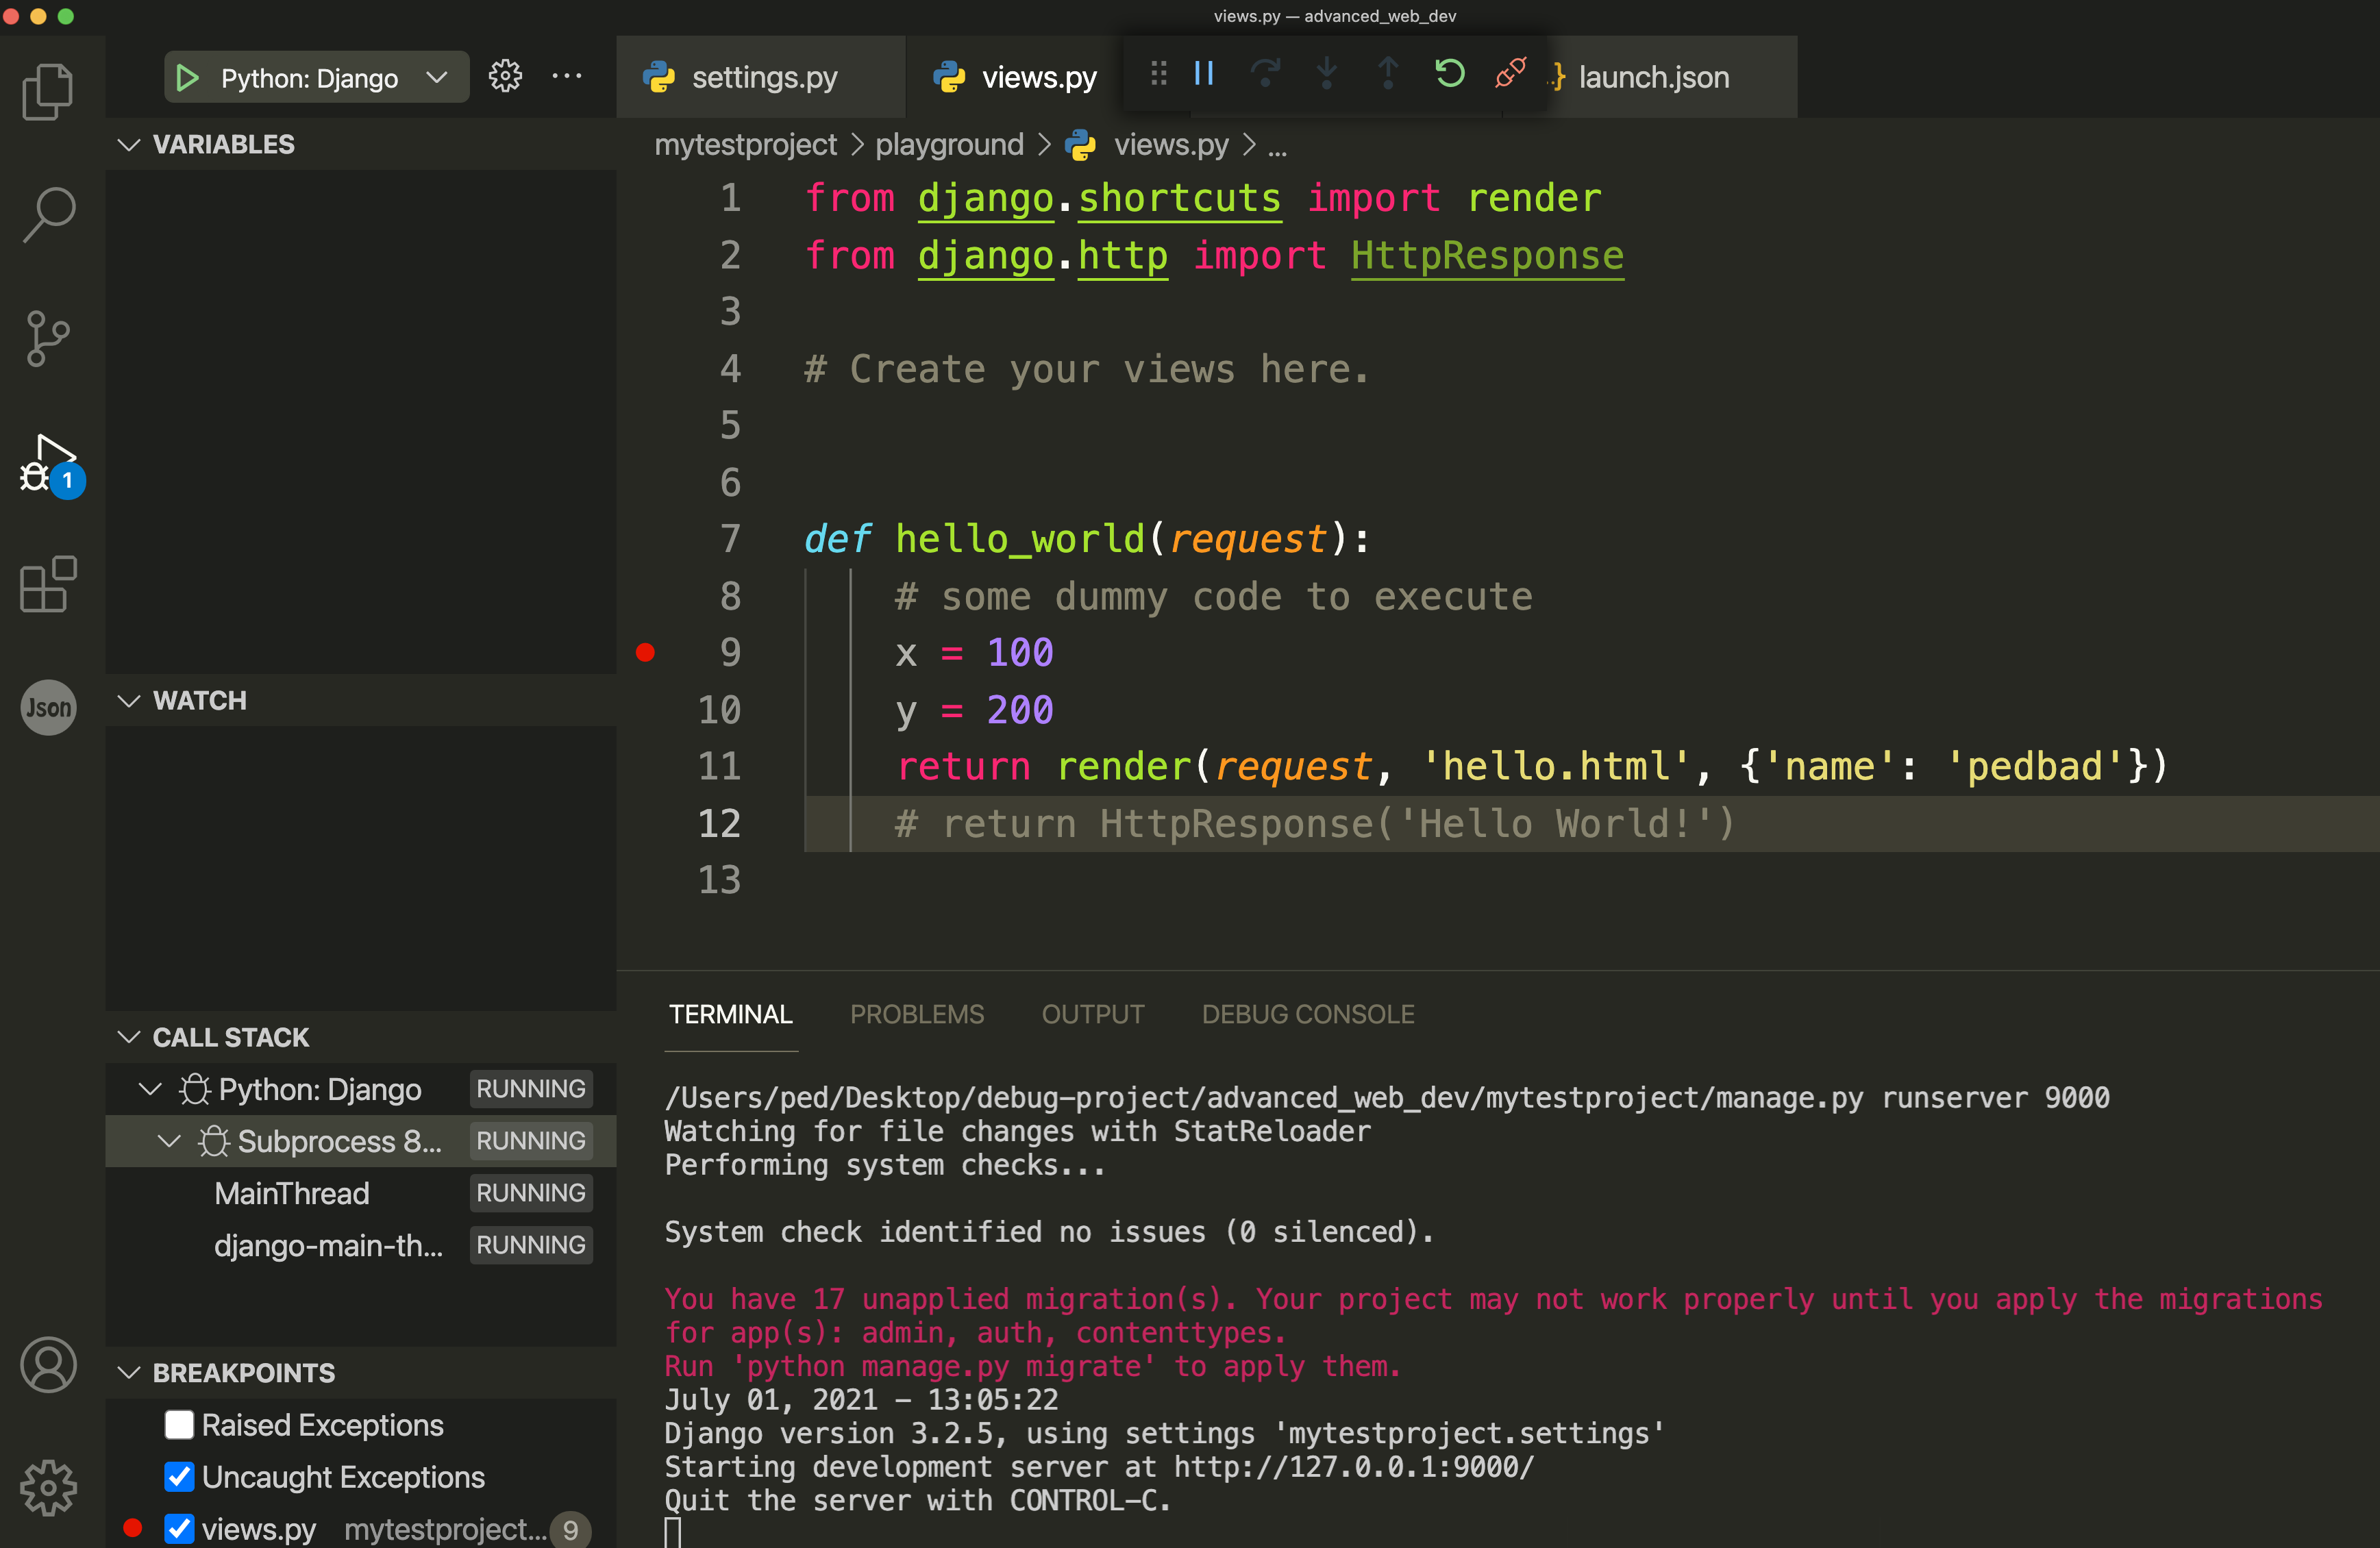
When you add a breakpoint, VSCode will execute every line of code until it reaches the breakpoint. After reaching the breakpoint you can start executing the code line by line.. So after inserting the breakpoint, you can start the application for debugging.
Notice that due to the modification of our launch.json file, the server is started on port 9000.
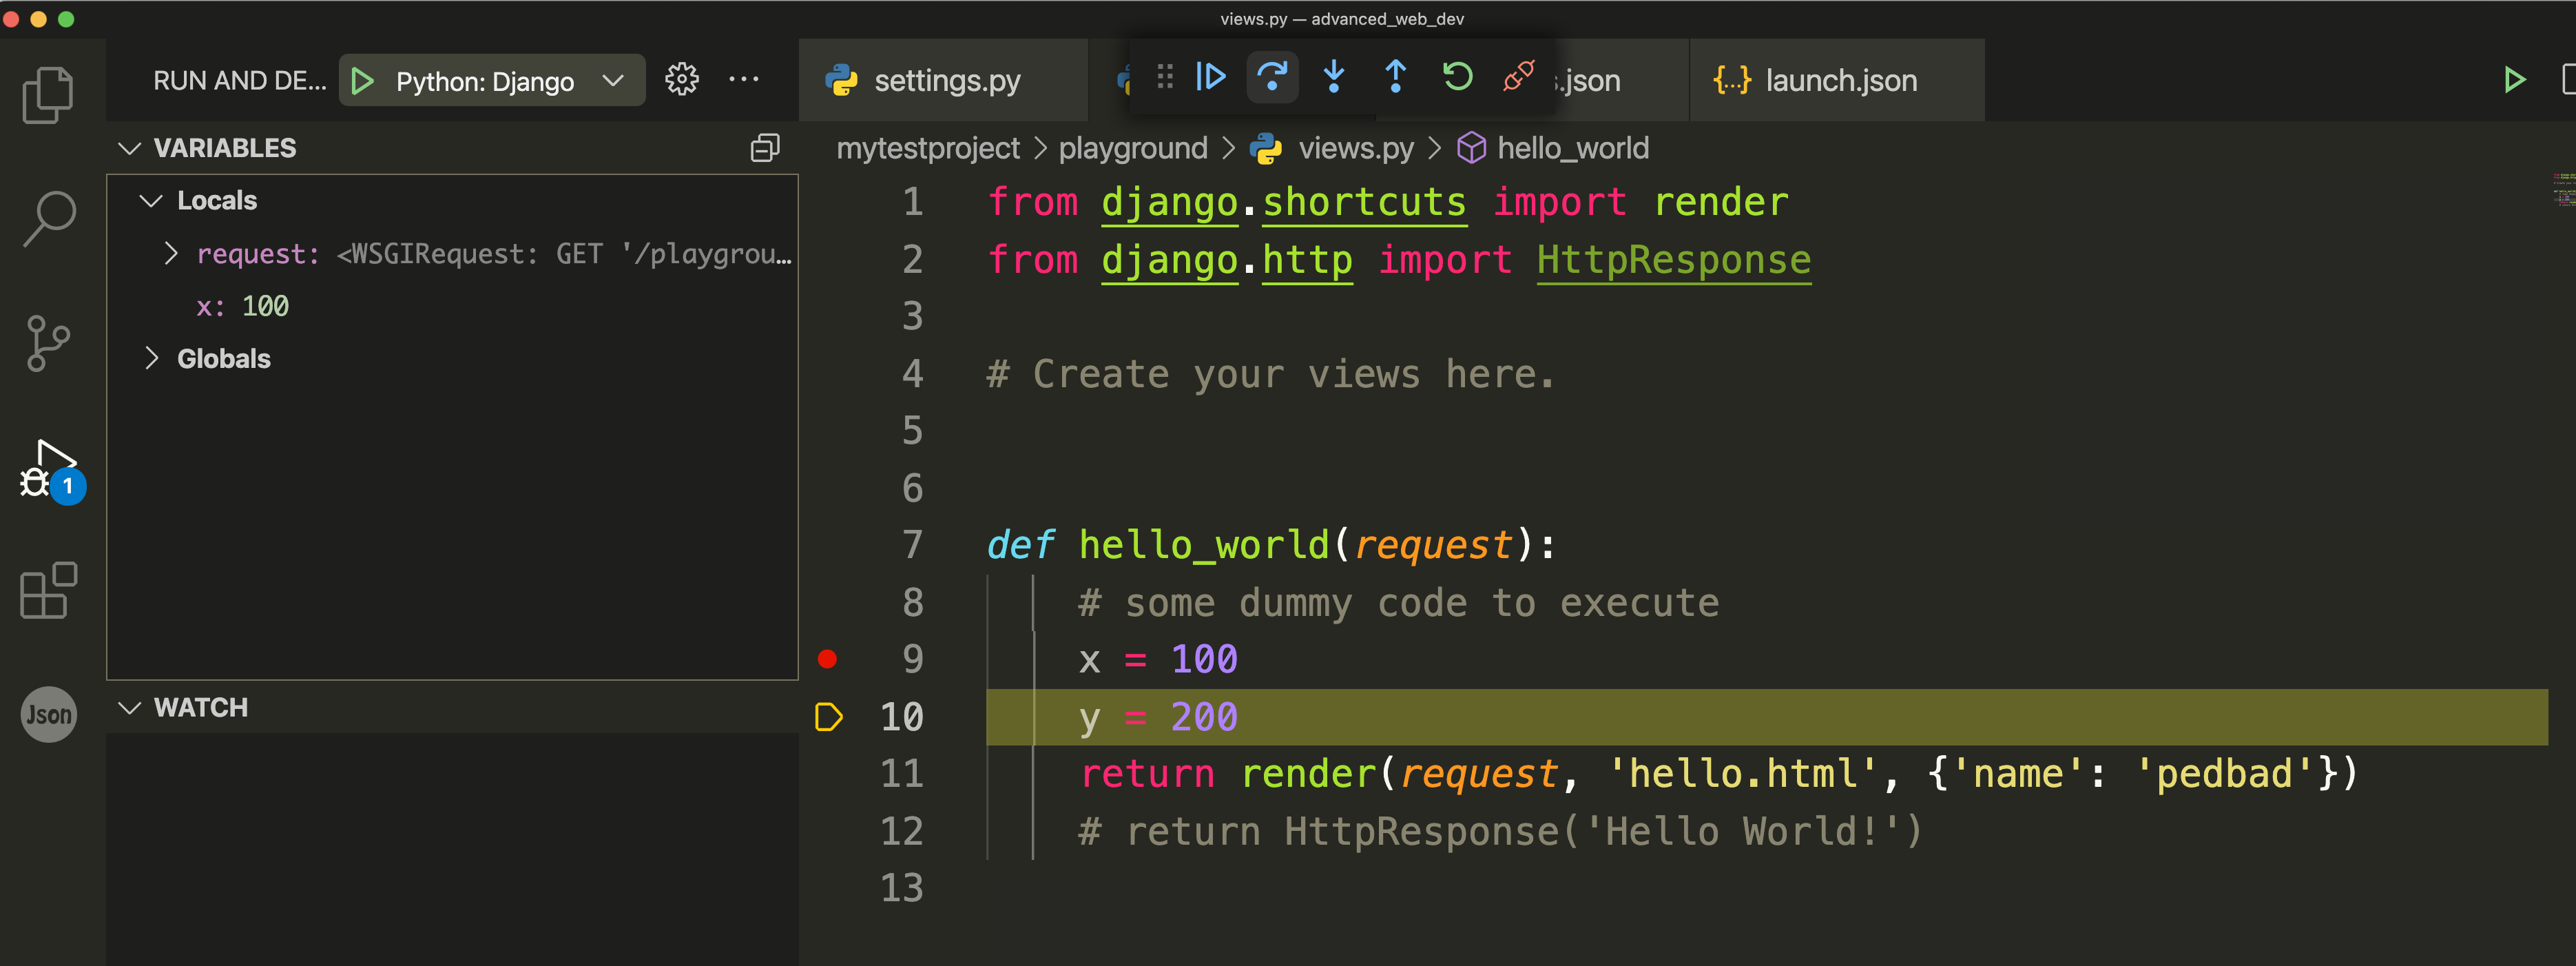
now we have the debugger setup, we can start using the usual debugging steps like stepover, stepinto, stepout to inspect our code at the point of the breakpoint.
You can launch the browser to visit the application url you want to debug, remember this is on port 9000.
now check : setting up the Django Debug Toolbar


